A Single Rejected Batch Is Never Just a Scrap Cost
Most manufacturers calculate the cost of a rejected anodising batch the same way: the weight of scrap aluminium, plus the chemicals used, plus the labour hours. They write off the number, log it as a quality incident, and move on.
But that number (the one on the incident report) is almost never the real cost. In most cases, it is 5 to 10 times lower than what the business actually absorbs.
The rest hides in delivery penalties, emergency overtime, expedited logistics, customer relationship damage, and the slow erosion of contract value when clients quietly start qualifying backup suppliers. None of these appear on the scrap report. All of them are real.
This post breaks down the true cost of bad anodising quality, category by category, and shows why the manufacturers winning on margin are the ones who have stopped treating quality failures as an operational nuisance and started treating them as a financial risk to be actively managed.
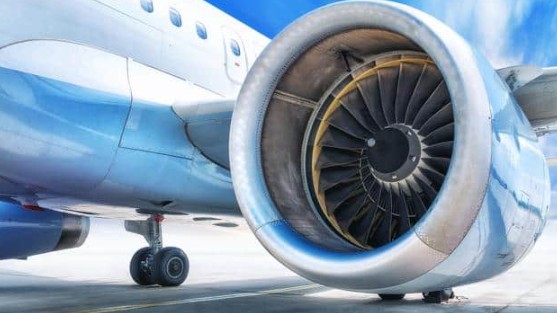
In high-specification sectors like aerospace, a single anodising quality failure can trigger delivery penalties, warranty claims, and contract loss far exceeding the original batch value.
The Visible Cost: What Gets Counted
The costs that do get counted are the direct, obvious ones. They are real, but they represent only the surface of the problem.
Raw Material Scrap
Aluminium is not cheap, and a rejected batch means writing off whatever material was consumed. For large-profile extrusions or high-alloy grades, this alone can run into thousands of pounds per incident. But it is still the smallest part of the total loss.
Chemical Waste
Every failed batch consumes sulphuric acid, dyes, sealing agents, and water treatment resources. Beyond cost, failed batches that require additional chemical disposal add environmental liability and regulatory reporting burden, both of which carry their own overhead.
Direct Labour Rework
Where parts can be stripped and re-anodised, the rework labour cost is quantifiable. But it is deceptive: rework ties up tank capacity that should be processing new orders, creating a knock-on delay that ripples through the production schedule.
What the Industry Data Actually Shows
The financial case for taking anodising quality seriously is not theoretical. It is supported by decades of manufacturing quality research, corrosion cost studies, and aluminium industry data.
Corrosion & Surface Treatment
- $2.5 trillion — The annual global cost of corrosion, equivalent to 3.4% of global GDP. Effective surface treatment, including properly executed anodising, is cited as the single largest preventable factor. Source: NACE International, "IMPACT" study, 2016. nae.edu/NACE-IMPACT-Study[2]
- $276 billion — Estimated annual corrosion cost in the USA alone across all industries, with protective coatings and surface finishing identified as the primary mitigation strategy. Source: NACE/FHWA Corrosion Cost Study, AMPP. ampp.org/spotlight-on-corrosion[5]
- 15–25% — Typical proportion of corrosion failures attributed to inadequate or defective surface treatment at the point of manufacture, not material failure. Source: ASM International, Corrosion: Understanding the Basics. asminternational.org[6]
Cost of Poor Quality (COPQ) in Manufacturing
- 5–30% of revenue — Range of Cost of Poor Quality (COPQ) reported across manufacturing industries. For most metal finishing businesses, the figure typically sits in the 10–20% band. Source: ASQ, Cost of Quality. asq.org/quality-resources/cost-of-quality[1]
- 4:1 ratio — For every £1 spent on prevention (process control, monitoring, training), manufacturers save £4 in failure costs. The inverse — spending on appraisal without prevention — yields much lower returns. Source: Juran's Quality Handbook, 7th Edition (2016). juran.com/quality-handbook[7]
- 25–40% — Percentage of a manufacturing plant's total capacity consumed by finding and fixing mistakes when COPQ is not actively managed. Source: Philip B. Crosby, Quality Is Free (1979). asq.org/quality-resources/cost-of-quality[4]
Aluminium & Anodising Market
- $4.2 billion — Global aluminium anodising market size (2023), projected to reach $6.1 billion by 2030 at a CAGR of 5.5%, driven by demand from construction, automotive, and electronics sectors. Source: Grand View Research, Aluminium Anodising Market Report, 2023. grandviewresearch.com/aluminum-market[8]
- 75% — Proportion of anodised aluminium consumed by the construction and architecture sector globally, where coating consistency and corrosion resistance are critical for long-term facade performance. Source: European Aluminium Association, Aluminium in Building & Construction, 2022. european-aluminium.eu/aluminium-in-use[9]
- 100% — Recyclability of anodised aluminium without special pre-treatment, making surface treatment quality a sustainability issue as well as a performance one. Source: European Aluminium Association, Sustainability & Recycling. european-aluminium.eu/the-material[10]
Quality Failure & Customer Retention
- 5–7× more expensive — Cost of acquiring a new customer versus retaining an existing one. A single quality incident that loses a long-term contract must be valued at the full lifetime revenue of that relationship. Source: Bain & Company / HBR, "The Economics of E-Loyalty", Reichheld & Schefter, 2000. hbr.org/e-loyalty-your-secret-weapon[11]
- 60–70% — Probability of selling again to an existing customer. Probability of converting a new prospect: 5–20%. Quality failures that trigger supplier switching carry disproportionate commercial consequences. Source: Farris et al., Marketing Metrics, Pearson Education, 2010. pearson.com/marketing-metrics[12]
- 96% — Of dissatisfied customers do not complain directly — they simply leave. For every formal quality complaint received, an estimated 24 other customers experienced the same problem silently. Source: TARP Worldwide / White House Office of Consumer Affairs research, cited by Help Scout. helpscout.com/customer-service-stats[13]
Energy in Anodising
- 30–40% — Energy costs as a proportion of total operating costs in a typical anodising line, making energy efficiency a direct profit lever alongside quality. Source: Aluminium Anodisers Council (AAC), Anodising Reference Manual. anodizing.org/anodizing-reference-guide[14]
- 15–35% — Potential energy reduction achievable through AI-based dynamic process optimisation in electrochemical surface treatment processes, based on published industrial trials. Source: European Commission, BAT Reference Document for Surface Treatment, 2019. bureau-industrial-transformation.jrc.ec.europa.eu/reference[15]
The Hidden Costs: What Never Gets Counted
This is where the real damage accumulates. Each category below is a cost that is genuinely incurred by the business but rarely attributed to the original quality failure.
1. Delivery Penalties and Contractual Fines
Many supply contracts, especially in automotive, aerospace, and construction, include penalty clauses for late delivery. A batch rejected on Thursday that was due on Monday creates an immediate financial liability that has nothing to do with the scrap value. Depending on the contract, penalties can easily exceed the value of the original order.
2. Emergency Production Costs
Recovering from a rejection usually requires priority scheduling: pushing a new batch to the front of the queue, running overtime shifts, or calling in additional operators. These costs are typically absorbed into general overhead and never traced back to the quality failure that caused them.
3. Expedited Logistics
When the re-processed batch finally ships, it often travels on an emergency freight arrangement (same-day courier, expedited pallet, or even a dedicated vehicle) rather than the planned consolidated shipment. The difference in freight cost between a planned shipment and an emergency one is typically 3–8 times higher.
4. Customer Complaint Handling
Every rejected batch that reaches a customer generates complaint handling activity: calls, emails, site visits, corrective action reports (8D/CAPA documentation), and management time. Conservative estimates put the administrative cost of a formal customer quality complaint at £500 to £2,500 in staff time alone, per incident.
5. Warranty and Field Failure Costs
The most dangerous scenario is when defective parts pass inspection and reach the field. Sealing failures in particular — one of the most common and hardest-to-detect anodising defects — may not show visible corrosion for weeks or months. By the time the failure is identified, parts may have been installed in facades, structures, or mechanical assemblies. Replacement and remediation in the field can cost 10–50 times the original manufacturing value of the affected parts.
6. Lost Future Revenue
This is the cost that never appears anywhere, but is often the largest of all. Customers who experience repeated quality failures do not always complain. Instead, they qualify backup suppliers, reduce order volumes, and eventually transfer the business. The link between a quality failure today and a lost contract twelve months from now is real, but almost never captured in the incident report.
Research consistently shows that it costs 5 to 7 times more to win a new customer than to retain an existing one (Bain & Company).[11] A quality failure that costs you a long-term customer needs to be valued at the lifetime revenue of that relationship, not the scrap value of the failed batch. And critically, 96% of dissatisfied customers never complain. They simply move their business elsewhere, silently.[13]
The Real Cost: A Worked Example
The table below illustrates how a single rejected batch (reported internally as a £3,500 scrap loss) can actually cost a business over £18,000 when all downstream impacts are included.
| Cost Category | Typical Amount | Usually Reported? |
|---|---|---|
| Raw material scrap | £2,500 | Yes |
| Chemical waste & disposal | £400 | Rarely |
| Direct rework labour | £600 | Sometimes |
| Overtime / emergency scheduling | £1,200 | No |
| Delivery penalty (3 days late) | £1,500 | Partially |
| Expedited freight | £800 | No |
| Customer complaint handling | £1,200 | No |
| Lost production capacity (opportunity cost) | £3,500 | No |
| Reputational / relationship risk (discounted) | £6,800 | No |
| Total True Cost | ~£18,500 | Reported: £3,500 |
The pattern is consistent across businesses of all sizes. The reported cost is the tip of the iceberg. The real cost sits below the waterline.
Why Bad Anodising Happens: The Root Causes
Understanding where quality failures originate is the first step to preventing them. In anodising, almost every defect traces back to one of four variables that drift during production.
Bath Chemistry Drift
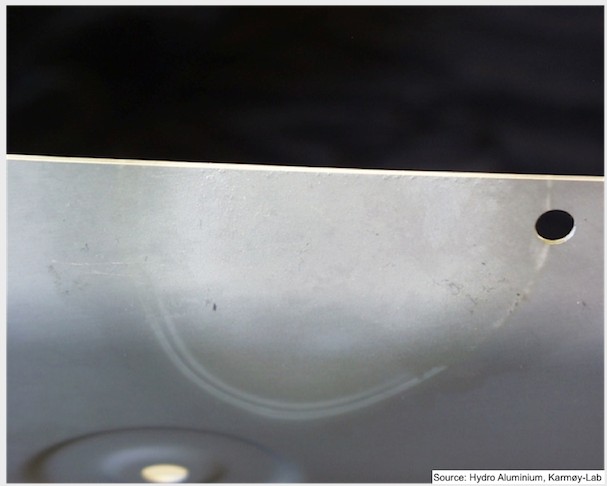
The concentration of sulphuric acid and dissolved aluminium in the anodising bath changes continuously as parts are processed. Without real-time monitoring and correction, the oxide layer produced will vary in thickness and porosity, sometimes within the same batch. Parts processed early in a shift may meet specification; parts processed late may not. The difference is invisible to the naked eye.
Alkali corrosion defect on an anodised aluminium part — a direct result of bath chemistry drift that goes undetected during production
Temperature Instability
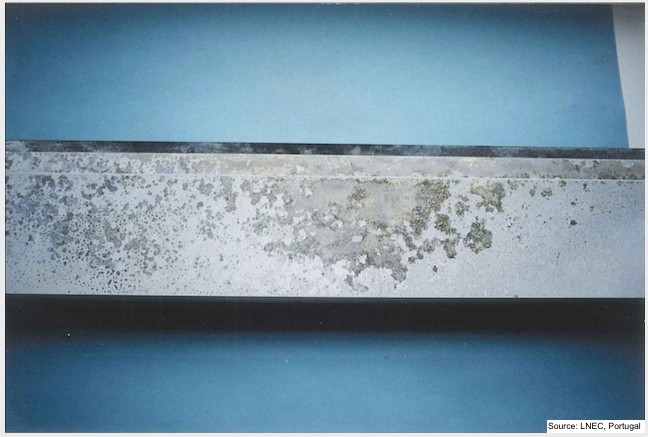
Type II anodising requires the bath to be held within a narrow temperature window, typically 18 to 22°C. A bath running just 3°C too warm produces a soft, "burned" oxide. Too cold, and the layer is thin and porous with poor corrosion resistance. Small temperature swings, compounded over a shift, create significant batch-to-batch variation.
Anodising burn defect caused by bath temperature running above the specification window — one of the most common and costly quality failures on the production line
Sealing Failures
Inadequate sealing is the most commercially dangerous defect in anodising. Parts look identical to correctly sealed parts, with no visual indicator to distinguish them, but they fail corrosion tests within hours. Sealing failures are frequently only discovered by the end customer, making the downstream cost impact maximum.
Racking and Contact Issues
Poor electrical contact between parts and the jig creates uneven current distribution. The result is inconsistent oxide thickness across the part, heavy in some areas and thin or absent in others. High rejection rates from racking problems are often misattributed to bath chemistry when the real root cause is fixturing.
Frequently Asked Questions
The most common root causes are bath chemistry drift (acid concentration outside specification), temperature instability (bath running too warm or too cold), and sealing failures. Sealing failures are particularly costly because they are invisible at inspection — parts look correct but fail corrosion tests in the field. Poor racking and electrical contact issues are also a frequent but often overlooked cause.
Start with direct costs: raw material scrap, chemical waste, and rework labour. Then add indirect costs: delivery penalties, expedited freight, overtime and emergency scheduling, customer complaint handling time, and any warranty or field failure costs. Finally, assign a commercial value to relationship risk — the probability of future order reduction or loss multiplied by the lifetime contract value. Most businesses find their true cost is 5–10 times the direct scrap figure.
Sealing failures are the hardest to detect and the most commercially dangerous. Parts that have been inadequately sealed look identical to correctly sealed parts — no visual indicator distinguishes them. They only reveal themselves when they fail a salt spray corrosion test, which is often only carried out by the end customer after delivery. By that point, the downstream cost impact is at its maximum.
Want to see how AI eliminates these failures at the source? Talk to the AluMind team today and discover how intelligent process control can raise your quality standards and protect your margins.
Book a Free DemoReferences & Sources
- [1] ASQ / Juran Institute — Cost of Poor Quality (COPQ) research. asq.org/quality-resources/cost-of-quality
- [2] NACE International — "IMPACT: International Measures of Prevention, Application, and Economics of Corrosion Technologies," 2016. nae.edu/NACE-IMPACT-Study
- [3] ASQ — Quality Cost Principles and the 1:10:100 Rule. asq.org
- [4] Philip B. Crosby — Quality Is Free: The Art of Making Quality Certain, McGraw-Hill, 1979.
- [5] FHWA/NACE — Corrosion Cost and Preventive Strategies in the United States, Publication No. FHWA-RD-01-156. ampp.org/spotlight-on-corrosion
- [6] ASM International — Corrosion: Understanding the Basics, J.R. Davis (Ed.), 2000. asminternational.org
- [7] Juran, J.M. & De Feo, J.A. — Juran's Quality Handbook, 7th Edition, McGraw-Hill, 2016. juran.com/quality-handbook
- [8] Grand View Research — Aluminium Anodising Market Size Report, 2023. grandviewresearch.com
- [9] European Aluminium Association — Aluminium in Building & Construction, 2022. european-aluminium.eu/aluminium-in-use
- [10] European Aluminium Association — Sustainability and Recyclability Facts, 2023. european-aluminium.eu/the-material
- [11] Bain & Company / Harvard Business Review — "E-Loyalty: Your Secret Weapon on the Web," Frederick Reichheld & Phil Schefter, HBR, 2000. hbr.org
- [12] Farris, P.W. et al. — Marketing Metrics: The Definitive Guide to Measuring Marketing Performance, Pearson Education, 2010. pearson.com/marketing-metrics
- [13] TARP Worldwide / White House Office of Consumer Affairs — Consumer Complaint Study, cited by Help Scout. helpscout.com/customer-service-stats
- [14] Aluminium Anodisers Council (AAC) — Anodising Reference Guide. anodizing.org/anodizing-reference-guide
- [15] European Commission — Best Available Techniques (BAT) Reference Document for Surface Treatment, EU-BRITE/JRC, 2019. bureau-industrial-transformation.jrc.ec.europa.eu